Stop investigating.
Start understanding.

When something goes wrong, the first 20 minutes of every incident get swallowed by the same manual work: opening dashboards, switching tabs, checking deployment history, trying to find which of your 40 services is actually responsible. Tsuga AI handles that phase automatically. By the time your team opens the alert, the answer is already there.

The manual steps that slow everyone down.

Teams don't cut logs because they want to. They cut logs because their vendor made keeping them dangerous. Short retention windows, expensive fields, opaque pricing - the incentives are all backwards.

When latency spikes, someone opens the service overview, filters by time, switches tabs, cross-references error rates. In large distributed systems that takes 20 minutes before anyone has even formed a hypothesis.

How Tsuga helps


The Explain capability scans hundreds of dimensions the moment a spike is detected and surfaces a plain-language explanation before your team opens the alert. The 20-minute investigation phase becomes a 10-second read.

The manual steps that slow everyone down.

Three ways AI makes troubleshooting faster.

Each capability is automatic. You don't write rules, train models, or configure thresholds. Tsuga AI learns from your data and works in the background so your team can focus on fixing things, not finding them.

Explain

Most incident investigations start with the same question: what changed? Engineers open dashboards, filter by time window, compare service after service, and try to isolate which dimension is responsible for the spike. In large distributed systems with dozens of services and hundreds of metrics, that manual process can easily take 20 minutes before anyone has even formed a hypothesis.

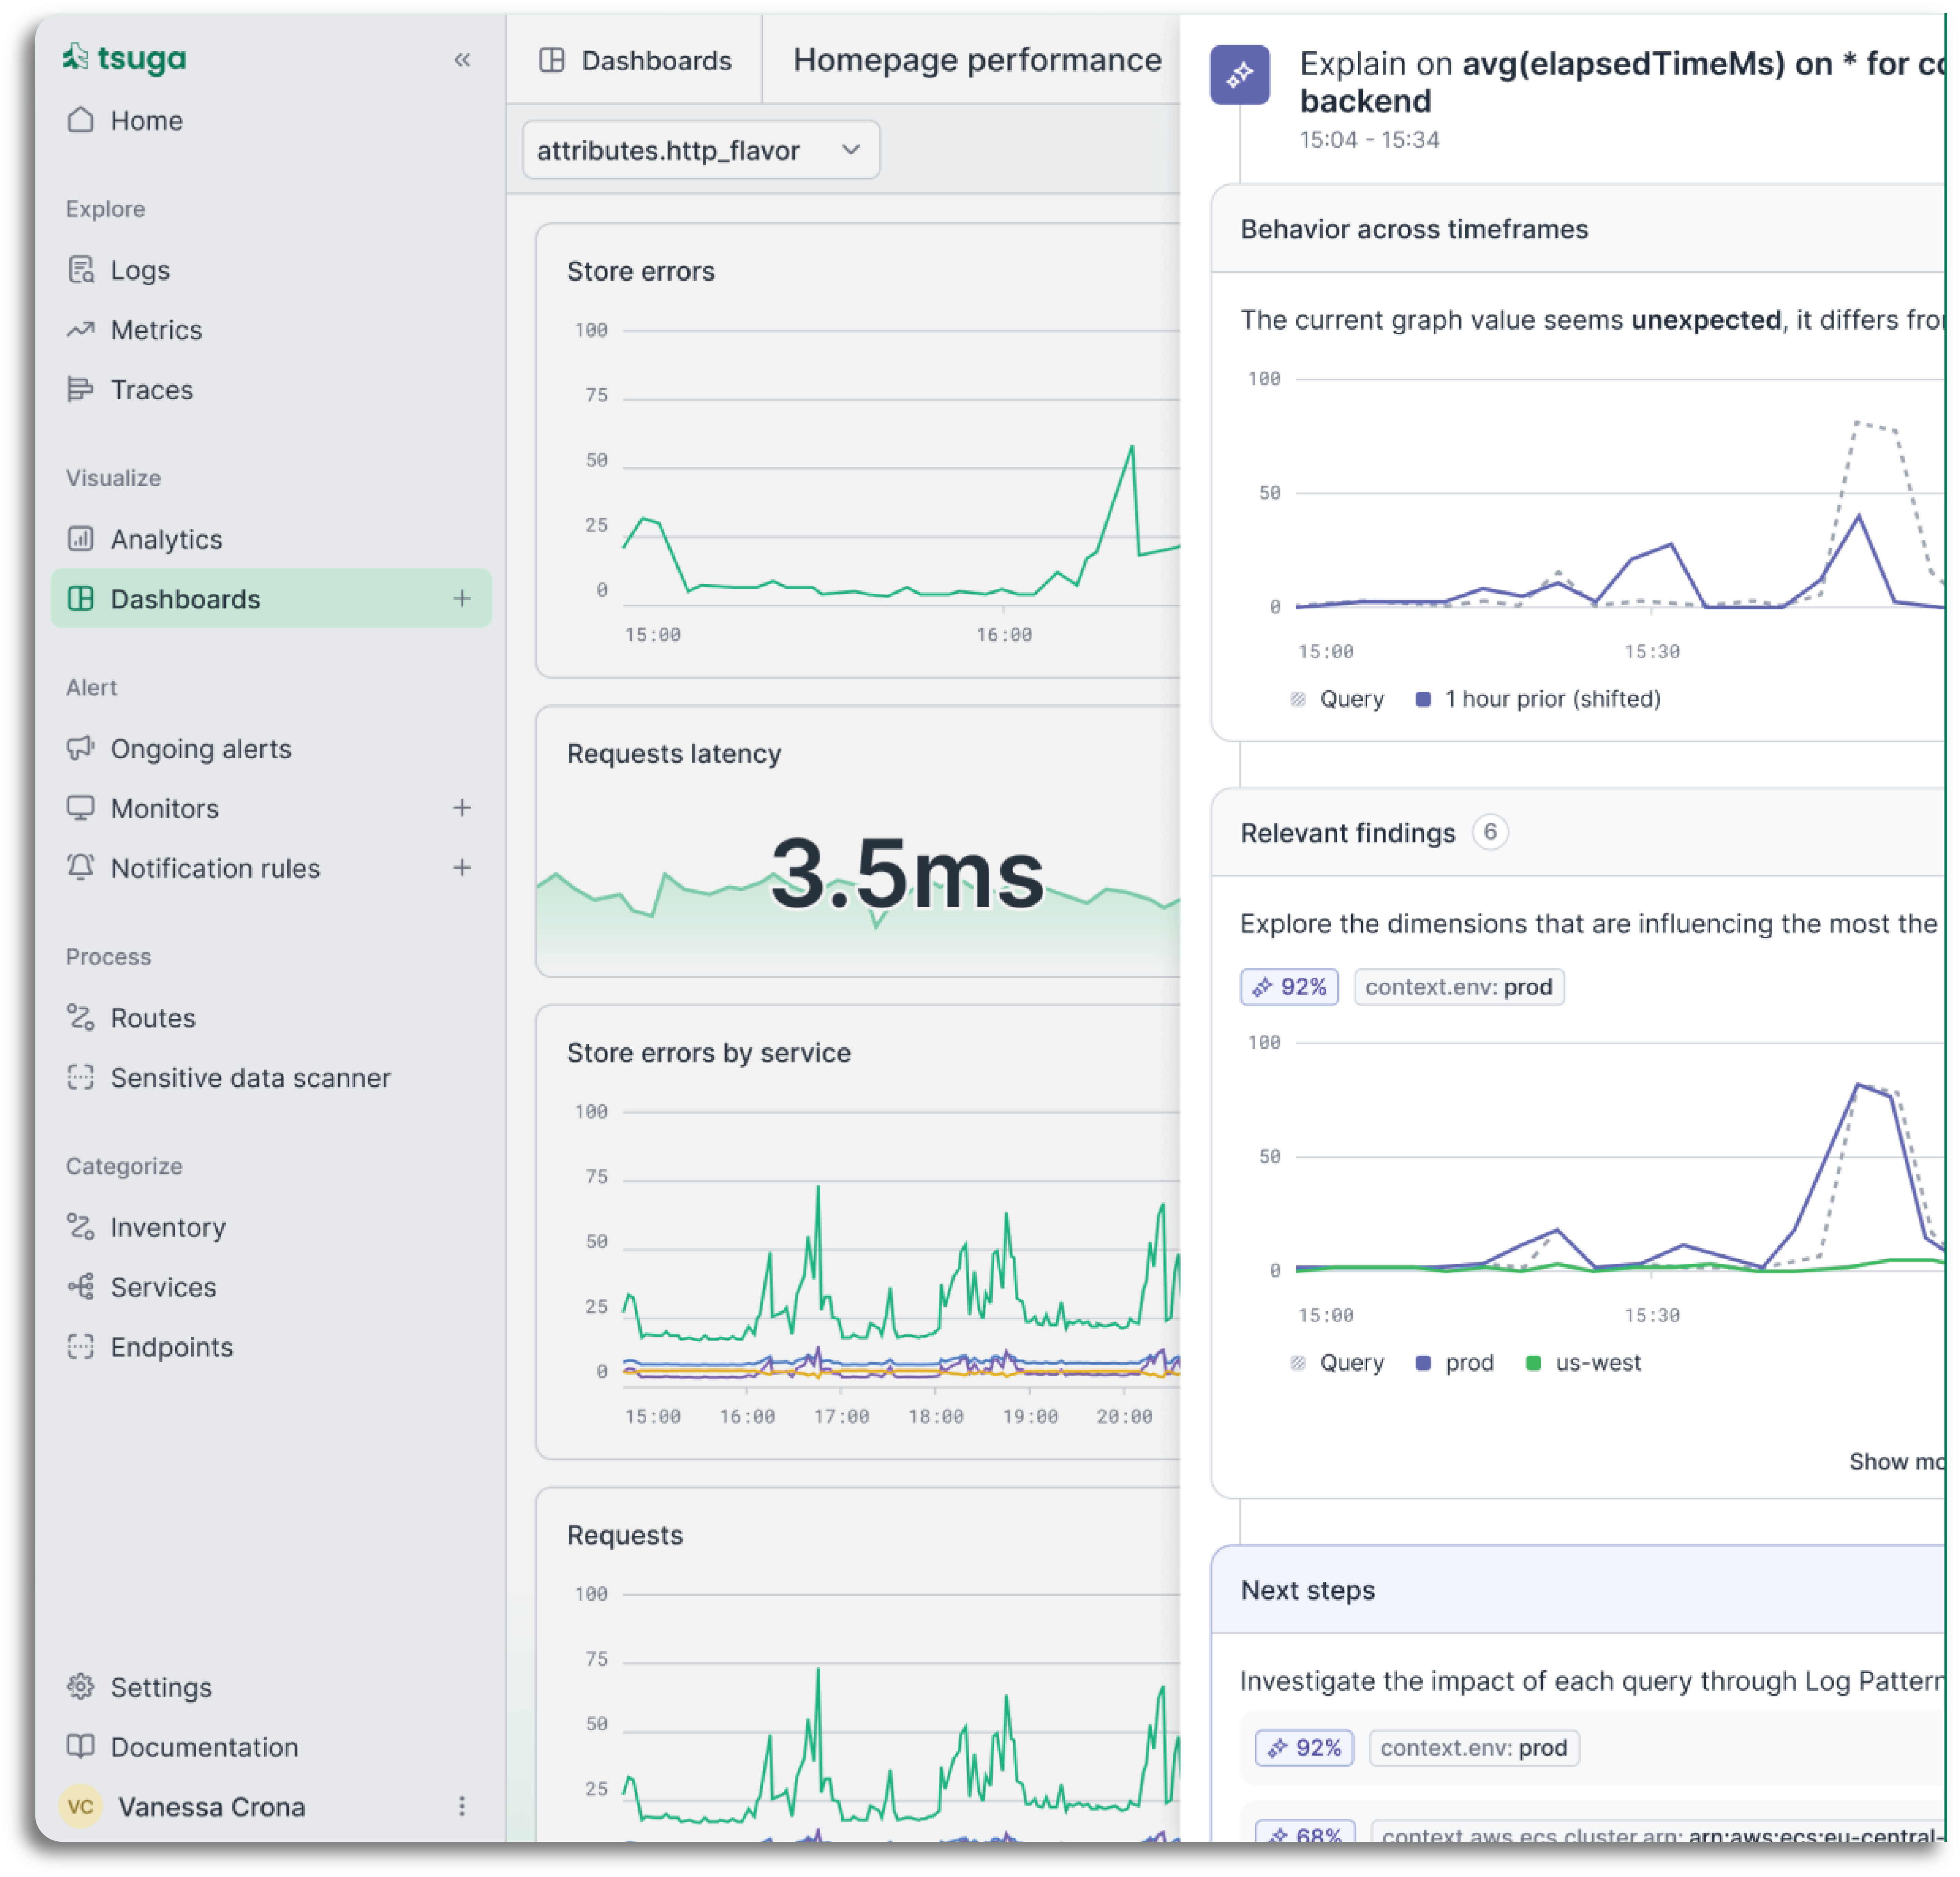
Tsuga AI's Explain capability does that work automatically. The moment a spike or anomaly appears, it observes the relevant dimensions across your entire telemetry estate, identifies the signals that changed at the same time, and surfaces a plain-language explanation alongside the relevant log and trace context. No dashboard-hopping. No manual correlation. Just the answer, ready when your team needs it.

  • Scans hundreds of dimensions to find what changed at the moment of the spike
  • Identifies the smallest subset of signals that explains the behaviour
  • Surfaces a clear explanation alongside the relevant log and trace context
  • Suggests where to look next, so investigation has direction from the start

Anomaly Detection

Static alert thresholds are a constant source of pain. Set them too low and you get alert fatigue from normal traffic variation. Set them too high and real problems slip through. Maintaining them for every service, endpoint, and environment is a full-time job that never quite catches up with how fast your systems change.

Tsuga AI learns what normal looks like for each signal over time, accounting for daily traffic patterns, weekly cycles, release cadences, and seasonal variation. When behaviour genuinely deviates from that learned baseline, it alerts. When it's just a Monday morning spike that happens every week, it doesn't. It also handles the edge case that static thresholds can't address at all: newly appearing errors that have no historical baseline to compare against. Those get flagged automatically the first time they show up, before they have a chance to become a problem.

  • Learns historical patterns per service, endpoint, and environment
  • Detects newly appearing errors that have no prior baseline automatically
  • Reduces alert noise by understanding what's actually unusual vs what looks alarming but isn't
  • Adapts as your systems change without manual threshold management

Faulty Deployment Detection

Every deployment is a potential regression. Even with thorough testing, performance degradations make it into production regularly, and by the time they show up clearly enough in business metrics to trigger an alert, the impact has already been running for minutes or hours. The people who shipped the code have often moved on to the next thing before the connection is made.

Tsuga AI watches every code deployment and continuously compares post-deploy telemetry against the pre-deploy baseline. It isolates changes to the specific service version that introduced them, distinguishes deployment-related shifts from background noise and unrelated incidents, and gives on-call engineers enough context to decide immediately whether to roll back. Regressions that would have taken an hour to diagnose manually get surfaced within minutes of a deploy landing in production.

  • Continuously compares post-deploy telemetry against the pre-deploy baseline
  • Isolates regressions to the specific service version that introduced them
  • Distinguishes deployment-related changes from background noise and unrelated incidents
  • Gives on-call engineers enough context to decide immediately whether to roll back

Own your observability.